Six Steps For Process Mining Project Success (Pt. 2) — System Logs & Data Model
In the previous article, we have introduced you to the overall approach to a Process Mining project and the roles involved. We also took a closer look at the first step — defining your Process Mining strategy.
In this article, we are looking at steps 2 and 3 of the process: extracting system logs and creating the data model that is needed for Process Mining tools. Especially step 3 is crucial for a project and you need to get this right. It also will be the step that will take the longest time in the project, so plan your time accordingly.

Step 2: Extract system logs
Now that you have identified the process in scope and articulated what you want to analyze (in the form of the hypotheses), it is time to go deep into the systems to get the right data that will support the Process Mining analysis.
Keep in mind, if you cannot find the correct data, it might be the proper time to raise a flag and go back to Step 1 (and the stakeholders) and re-assess if you have chosen the correct process. It is better to go back to square one than occupying valuable time from all people involved and have a mediocre result that disappoints your stakeholders. Remember: you want to build momentum and excitement for this new analysis technique and technology.

Extracting system logs in mostly composed of three steps: identify systems used, build integrations to them (optional in your projects), and the actual extraction.
- Identify systems of record and additional systems needed to give context when analyzing the hypotheses: Most likely you will have more than one source system for your process (for example a procurement system, a warehouse system, and a financial system in a Procure-to-Pay process) that might or might not share the same identifiers for the individual process instances/cases.
In this step, you need to do three things: identify the source tables in the systems, determine which columns you have to include (based on your hypotheses, and most likely an DB administrator will have to write a custom query for you), and the output format of that data. Determine if you get one big file or do you get multiple tables based on the type of information that you will need? The general rule of thumb would be that you want multiple tables – the actual activities and their timestamps, and then additional attributes for each step in this activity log in one or many files. In Step 3 you will combine them in a way that makes sense.
One thing you also need to understand is if data will be changed in different systems during the execution of the process, and you need to determine which status of that information you want to use for your analysis. - Build technical integrations (optional) — this is a step where you will set up automated feeds from the source systems to your data modeling or mining tool. I do not recommend doing this in your first projects because it adds a lot of complexity to the project, which can make the timeline for it explode. Just think of security approvals, or the used technology — does your Process Mining tool have a dedicated adaptor for your source systems or do you have to develop a custom interface (and who can do this), and so on?
Keep it simple in the beginning and save the automated feed integration for a future version of your analysis. At first, you want to show results quickly. - Extract system logs is the last step. Here you will have to decide how you organize your results, where to store them, and which naming convention you apply to the files.
This is no problem if you have built a technical integration, but can be complicated if you work with exports from databases and other systems. For example, I worked on a project with a bank that gave us the online transactions of their customer’s investment changes, which were recorded from three different systems. Besides that, it was challenging to connect the three sets of records, once we had created the initial data model based on one-day, they gave us the records of one month (90 files instead of the original three). The data modeling tool that we used was able to simply switch from read this file to read all files in this folder, and it automatically removed redundancies, etc.
Long story short, you should have a plan on how to organize your source system logs and plan it in a way that it makes it easy to expand if you get a mass export of data. What you should avoid doing is to artificially reduce the amount of data that you will get – the more you have (and I am talking about hundreds of thousands or millions of records), the better your analysis will be.
Step 3: Create event log
This step is the most crucial step in the whole approach. Get this wrong and all steps downstream will be wrong, and your recommendations might be invalid.
Use a graphical took for creating your data model
When approaching the creation of even logs, there are various tools out there, and typically the Process Mining tools ship with some form of transformation capability. Those are most likely in the form of nerdy SQL queries or other forms of code, and not necessarily stakeholder-friendly. Even if you have the necessary skills for this in-house, the use of “coding” might be a turn-off for your business stakeholders, and also might be difficult to learn for them. One of the objectives that you might have defined in Step 1 might be that you want to roll out Process Mining in your organization, so you should avoid anything that makes things more difficult than it has to be.
I recommend using a graphical data modeling tool for this step, and there are commercial tools like Alteryx, as well as open-source tools like KNIME available. These tools also come with training and certification offerings, as well as good documentation/videos and (maybe most importantly) an active user community that can help you to figure things out how to set up the transformations. This will simplify the roll-out of the tools significantly.

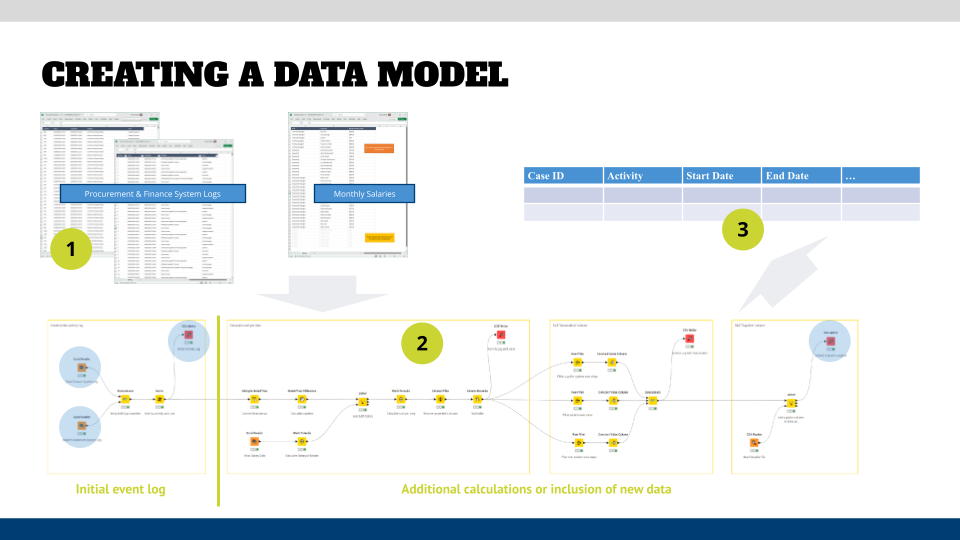
Create the data model
Creating the necessary even log in the format that Process Mining tools require can be a challenging exercise. You need to be aware of every step in your data transformations that you do not accidentally lose or add data to the final table. Your end table must have at least the first four columns shown in the graphic above: Case ID (so that you can trace the events by their timestamp), Activity Name, and Timestamp(s). Ideally, start and end timestamps so that the tool can not only calculate how long it took to get from step A to step B, but also how long it took to perform step A. The tool will then give you additional statistical calculations on them like average, mean, max and min values.
To create a data model in a graphical tool like KNIME you have to:
- Import event logs into data tool: KNIME has tons of connectors to flat files, databases, etc. so that you can read almost any file type that you throw at it. Once you have it in the tool, you can see the columns and determine if the data was imported correctly.
Obviously, you can import more than one source file or connection, and you can also create your own (reference) tables that you might need for calculations, as well as export the final table(s) in all common formats. - Cleanse your data: this is the first crucial step, and it includes a mix of table changes like removing columns that are not needed, or changing the format of a column. Row edits like filtering out events that are not applicable because they include cases that already were in progress when you took a snapshot. Or you have to do cell-based edits like harmonizing strings or date calculations, for example if one source system stores timestamps in 24hr format, while another one uses AM/PM format.
- Create initial event log: focus on the base information that you require for your process mining tool and upload a first version of your event log into it. What you want to see if it: a) loads, or you need to tweak the table (date formats are always troublemakers), and b) if the result that you see makes sense at a first glance.
Go back and check your data model if your initial event log is not correct. - Fine-tune your data model: this is where the fun starts. Go to your list of hypotheses and see what questions you can derive from them to be able to reject or validate them. Check your data if you have all information available to answer the questions and determine if you have to calculate additional metrics. A little further below, we are discussing the example of an incident management process – you might have to calculate which percentage of cases are escalated to a Level 2 support organization.
During your process analysis, you will see plenty of iterations of changing your data model once you have presented your initial results to the stakeholders and collaborators. Therefore, you might become very familiar with your data modeling tool and/or the calculation features that the Process Mining tool might have.
Validate your data model
Once you have done your initial data model created, load it into your Process Mining tool and schedule a data validation session with your stakeholders. The main objective of this session is to validate the data model itself and not so much the results that the tool shows.
I typically start this workshop with reminding the participants that this is a working session and the main aspect is to ensure that the data model is correct. Then you should walk them through your data model, and here it is very helpful that you use a graphical tool and not just a series of SQL queries or Python scripts. Those are typically not the skills that your stakeholders have, which result in them checking out because it is just blah blah for them.
An added benefit of using a graphical tool is that they are self-documenting. They allow you to add descriptions to the workflow nodes and also group nodes into logical chunks of your data transformations — up to the point that you create collapsible and reusable groups that can be referenced in other workflows. Very helpful when you create data models for similar processes or when cleansing your data.
One reaction that I have seen over and over in projects is that stakeholders become defensive and claim that your data model is not correct and therefore the spaghetti diagram that they see in the tool cannot be correct. This is the time to ask them to give you some case numbers and check the information in the tool (e.g., timestamps or the sequence of steps) in the source systems like an ERP or CRM system.
You might find some errors, which is good and most likely a result of assumptions that you and the stakeholders have agreed on. Analyze where the error in your data model might be and iterate on the data model.
It is crucial that you get the OK from your stakeholders that they believe that your data model is correct, otherwise all other steps are moot. Have all participants state that they agree with the correctness of the data model before you release them from the workshop.
What’s Next?
In the next article of this series, we will look at the next two steps in the process: creating a reference process model (for conformance checks) and analyzing the process.
Roland Woldt is a well-rounded executive with 25+ years of Business Transformation consulting and software development/system implementation experience, in addition to leadership positions within the German Armed Forces (11 years).
He has worked as Team Lead, Engagement/Program Manager, and Enterprise/Solution Architect for many projects. Within these projects, he was responsible for the full project life cycle, from shaping a solution and selling it, to setting up a methodological approach through design, implementation, and testing, up to the rollout of solutions.
In addition to this, Roland has managed consulting offerings during their lifecycle from the definition, delivery to update, and had revenue responsibility for them.
Roland has had many roles: VP of Global Consulting at iGrafx, Head of Software AG’s Global Process Mining CoE, Director in KPMG’s Advisory (running the EA offering for the US firm), and other leadership positions at Software AG/IDS Scheer and Accenture. Before that, he served as an active-duty and reserve officer in the German Armed Forces.