Six Steps For Process Mining Project Success (Pt. 3) — Reference Model and Process Analysis
This is article 3 of our series how to do a Process Mining project. In the previous articles we took a look at the Process Mining strategy, the extraction of system logs, and the creation of a data model. In this article, we discuss the next two steps: the creation of a reference model for conformance checks (an analysis type), and the analysis of the discovered process in the Process Mining tool.

Step 4: Create reference model
As mentioned above, there is an analysis technique called conformance check that compares the runtime data in the even log with the reference process that describes how work should be done.
This is the time for two things – first, to create a proper process diagram in BPMN notation, especially when you just have a “napkin-level” process created in Step 1. But second — and maybe more important — you should review the process diagram to update information that might be outdated since the last update/review or remove inconsistencies in the process flow. The outcome of this step should be that everyone agrees that this is how the work should be done under the current constraints like existing IT support. If you already notice ideas how to improve the current state, note them either as a hypothesis for the next Step 5 (“What happens if we remove this step completely? This would take out one system from the process, and we could retire that app.” could be a valid result), or directly as an opportunity for Step 6 in which you would create the business case for that idea.

Please note that, most likely, you will just have the “happy path” being documented and maybe a few exceptions. This process is created by what the SMEs know or want to tell you and is therefore highly subjective – which is OK at this point. You will be surprised to see the creativity of users to bypass “inconveniences” and “process gaps” when running that check.
Step 5: Analyze process
This is the main step that everyone has been waiting for – you finally take a more in-depth look at the process that was “discovered” by the software based on the event log.
When doing the analysis, which comprises many analyses techniques, I suggest doing this in two steps – a high-level analysis and a more detailed analysis which will then go into the different hypotheses from Step 1. In either of those steps, though, keep in mind that the tool will just show you the “what” – there might be no context in the data or any additional hint. You, as the analyst, will have to look for the Why, How, Who, and When and your hypotheses will guide this search.

High-level process analysis
In the high-level analysis, you typically look for these items:
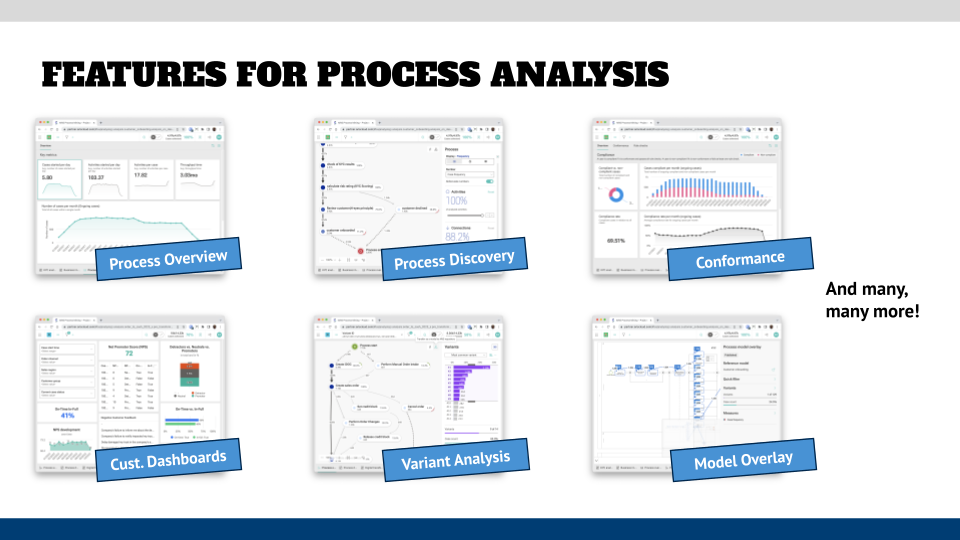
- Overview dashboard: This might not be relevant for your first process mining project, but it is a good idea to define standard KPIs for your processes that stay the same for every process that you will analyze. Some tools have already a pre-built dashboard for this, but you might want to customize this and add metrics like number of cases, average duration, degree of rework, degree of parallel work, distribution over time, etc.
Having this standardized overview dashboard for every process brings focus to your process analysts and process owners on what is important for you as an organization and allows an “oranges to oranges” comparison. - Process discovery: Process Mining tools “discover” processes based on the sequence of the steps in the event log and their time stamp. This can show plenty of interesting observations, for example with which events the process starts or ends, or which loops might show up. In these cases, you will have to see if it is really a process path that you are looking at, or if your data set is “skewed” because you have not included all events of already completed cases (because you defined a cut-off date). Or if some cases simply have not completed yet.
You might want to change your data model for the first case, and highlight the “in progress” cases in your analysis.
Please note that some Process Mining tools allow you to export a process to their repository. If your tool can do that, I recommend applying the 80/20 rule and select all variants that cover 80% (-ish) of all cases and exporting them as a BPMN diagram. In your repository, you can then do a model comparison with the diagram that you have received from your client or created in Step 4. You can even go back to Step 4 and use that input to refine the reference model that will be used in the conformance analysis below.

- Frequency Analysis: This is the first major question you are asking – how many cases go through a certain path. This will determine if you will focus on other aspects in later analysis (is it critical that this group of processes take significantly longer than others, if the total cases are just 0.2% of the overall number of cases? Most likely not), and you can identify the “happy path” aka the most used path and compare it quickly with your reference process to find exceptions and potential areas of further investigation.
- Time Analysis: Besides the question “how many?” the second most important question is “how long” (remember the levers of a process from Step 1?). In this analysis, you look at the time that certain processes take – this can be the overall process execution time, or the time a single step in your process takes.
Compare that with the SLAs that you have captured in Step 1. Do you see a discrepancy? Is that a general problem, or can you isolate certain conditions for the discrepancies – for example, certain products or vendors in a Procure-to-Pay process? - Bottleneck analysis: this is a variation of the Time Analysis where you explicitly look at the delays that are showing up. Often, this is organization-related (you just don’t have enough people and the cases pile up), or a lot of rework needs to be done, which slows down the organization that is working on the cases.
Note these numbers and use them in the process simulation detailed analysis below, to figure out if and how this issue can be solved. And occasionally the difficulty is not “in the chair” but your means of transportation is outdated, i.e., you have things pile up in email inboxes instead of using a workflow system that has dynamic routing of cases.
Detailed process analysis
The detailed analysis now can drill down into more aspects of the Why/How/Who/When by using these techniques:
- Filters: Most likely, your initial discovered process does not have a clear picture or observations presented to you. Go to your hypotheses and use the filter functionality of your tool to dig deeper into aspects of the process. Filter by assignment group of the Level 2 support in an incident management process to see if some L2 groups perform better or worse than others.
Save these filters globally for your project and come up with a naming scheme for the filters. You can easily replicate the view in a dashboard without having to click around for five minutes every time you want to revisit your analysis. - Variant analysis: Variants are “walkthroughs” of cases through the process, as shown in the graphic below. What you would like to look at are the most used variants and you most likely will see a long tail representation where the majority of all cases are in the first 5–10 variants. The distribution tapers off until at the end of the variants you will see the one-off cases.
Most likely, you would rather not focus on the outliers — except if there is a specific reason for it. For example, you have cases that have a very high cost, and you want to analyze why that is — but rather apply the 80/20 rule again and look for the majority of cases.
In some tools, you can also overlay the BPMN diagram / reference process with the variant data (filter by variant) and you can more easily identify where the variations occur – sometimes you might even see that there are multiple exception in a variant.

- Conformance check: This is the analysis where you load your reference diagram into your process mining tool, and it compares the data set to your diagram. It will show you the differences between the two and the associated statistics for each, like frequencies or times.
Typically, you will get multiple results from this analysis – for example an overview dashboard of your overall compliance to the reference process over time and absolutely (as percentage), which you can filter on. Or you get a detailed list of conformance violations, such as wrong start or end event, or sequence of steps, which you can immediately use as the starting point for more analysis and/or identification of improvement opportunities in Step 6.
In my opinion, this is the “killer analysis” to get risk people on board with Process Mining because the Third Line of Defense (independent validation) is extremely interested in seeing what process participants really do. Process Mining can give them crucial insights that will help them in their auditing efforts. - (Custom) dimension/metric analysis: Custom dimensions and metrics are the detailed pieces of information in your data set that you will assemble to validate/reject the individual hypotheses.
My recommendation is to build a single dashboard for each hypothesis and avoid creating “one-size-fits-all” dashboard if the hypothesis is not related to each other (even then I typically recommend individual dashboards because in some tools you have very granular permission controls so that you can specify a subset of analyses for certain stakeholder groups so that they are not overwhelmed by what you have found). - Role analysis: This analysis changes the perspective from the steps in the process to the participants. Some tools already provide this overlay out-of-the-box, while for others you might have to load your data model, so that the “activities” in the tool are the roles that you have in your data set. This will show the main interaction between roles/teams that might give you additional insight into the context of the process – for example, that certain roles/groups are systematically excluded from the process, which then creates delays.
- Data Flow Analysis – by system: For this analysis you want to look at two perspectives – one is the sequence by application to find potential missing automated interfaces where a human has to enter data as the “swivel chair interface”. This always has the danger that information gets lost or tweaked, which might create additional bottlenecks because further downstream in the process there needs to be an additional verification/correction step.
The second is the analysis of the degree of automation of the process. For obvious reasons, the higher degree of automation exists, the better the data quality will be that is used in the process. This, and management of the workflow, might have the largest impact on the performance of your process. - Case analysis: While until now, you have looked at patterns of processes, the Process Mining tools also allow you to look at individual cases and how they flow. This will help you find the specifics and context that will help you to interpret what you see in the higher-level flows (e.g., in bottlenecks or variants).
- Prediction: Some Process Mining tools have predictive capabilities using AI/machine learning to project how a case in progress will end with a certain probability. This information can also be used for triggering actions that some tools allow – for example, if a container is stuck in a harbor in China. The prediction can give an estimate on what it learned from the data set how long this typically takes, so that one can change the production planning to avoid delays.
- Simulation: Typically, Process Simulation is a separate component of a Business Process Management suite and only rudimentary what/if functionality is included in a Process Mining tool. I highly recommend taking a closer look at a full-fledged Simulation tool in the context of Process Mining projects because the functionality will help you to detail your improvement proposals.
In general, you want to take the metrics from Process Mining and use them to create a baseline simulation, which will give you a starting point for comparisons of simulation scenarios by calculation of resource utilization, waiting times (static, dynamic), etc. You can then fine-tune your identified opportunities later to see if for example the change of number of resources will remove bottlenecks, and then furthermore if you can remove people from downstream activities and which impact that might have (“Does this remove the bottleneck upstream but create a new bottleneck downstream?”). Or you can see the usage of other, non-human resources and optimize your recommendations toward the better utilization of those, say, in a production process. Or you can simulate what the reduction of exception paths in a process would have on the process, or have the Simulation tool calculate the most optimal use of resources and apply a schedule to it.
The possibilities are — literally — endless, and you will have to decide when “good enough is good enough” for your simulation analysis if you would rather not have the overall project schedule explode. The criteria for “what a good process looks like” from Step 1 will give you guidance on this.

The possibilities seem to be overwhelming for beginners, but the more Process Mining projects you have done, the more you will realize what the overall behavioral patterns in your organization are. Just remember: each of those analyses should be aligned to your hypotheses, and you should create one dashboard for each hypothesis in the tool.
Present analysis
When you have done your initial analysis, invite your team for a presentation of the initial findings. What you typically will see is that there will be plenty of questions coming up or attempts to explain why certain patterns show or why certain org units show a (lower) performance. Note these remarks and add them to your hypotheses for the second round of analysis.
What you will also find is that a lot more questions might come up. For example, in one project in which we analyzed the IT incident process of a bank, we looked at the number of cases that have been escalated and showed that a certain software/hardware had more escalations than others. This is a finding in itself that has a value, but then the question came up on how many of those escalated incidents were escalated to the third level of support (typically the vendor) and what impact that had. The questions from the team are invaluable for your future identification of opportunities, but that also means that you have to go back to your initial analysis and then to your data model to add more calculated metrics (like the escalation of escalated incidents).
I highly recommend limiting the number of iterations in your project plan/charter to not more than two. What you want to accomplish, as you might remember, is to create momentum and show initial results and improvements in the process execution fast.
What’s Next?
In the last article of the series, we will look at the last step of the process — the identification of improvement opportunities.
Roland Woldt is a well-rounded executive with 25+ years of Business Transformation consulting and software development/system implementation experience, in addition to leadership positions within the German Armed Forces (11 years).
He has worked as Team Lead, Engagement/Program Manager, and Enterprise/Solution Architect for many projects. Within these projects, he was responsible for the full project life cycle, from shaping a solution and selling it, to setting up a methodological approach through design, implementation, and testing, up to the rollout of solutions.
In addition to this, Roland has managed consulting offerings during their lifecycle from the definition, delivery to update, and had revenue responsibility for them.
Roland has had many roles: VP of Global Consulting at iGrafx, Head of Software AG’s Global Process Mining CoE, Director in KPMG’s Advisory (running the EA offering for the US firm), and other leadership positions at Software AG/IDS Scheer and Accenture. Before that, he served as an active-duty and reserve officer in the German Armed Forces.